Pricing Problems: What Overpriced Listings Are Telling Sellers Across Coastal Orange County
.jpg)

There is a pattern showing up across every Coastal Orange County market right now. There are enough homes sitting that the data is telling a clear and consistent story about what happens when a seller comes to market priced for a different buyer than the one actually writing checks.
This is not a story about a market in distress. Every city in this report is still registering a Slight Seller's Advantage. What has changed is the buyer.
Today's buyer along this corridor is deliberate, financially sophisticated, and has access to the same data I do. They know when a home is priced correctly and they know when it is not. When it is not, they wait. And while they wait, the days accumulate.
Understanding what those days cost is the most important thing a seller can know right now.
What the Data Is Actually Showing
Across the markets covered in this report, the gap between average days on market and median days on market is the number that matters most and the one most sellers never think to ask about.
Average DOM is pulled upward by the listings sitting the longest. Median DOM reflects the middle of the market. When those two numbers diverge significantly, it means a segment of the market is stuck while the rest moves. That divergence is present in every city in this report, and in some of them it is striking.
Laguna Beach is carrying an average DOM of 162 days against a median of 81. Newport Beach is at 144 days average against a 91-day median. Every one of those gaps represents listings that came to market at a price that did not reflect today's buyer. Well-priced homes moved through in roughly half the time.
This is not bad luck. It is a pricing problem, and it has a cost that compounds with every week a home stays active.
Laguna Beach

There are 148 homes for sale in Laguna Beach right now, and they are sitting longer than anywhere else in this report. The average home has been on the market for 162 days. The median is 81 days. That gap tells you something important: half the market is moving in about three months, and the other half is barely moving at all. One in three listings has already had to drop its price. One in ten came off the market completely and relisted.
Sellers who came to market earlier priced too high. New sellers are listing lower because they can see that. The market is correcting itself, but slowly. For buyers, that creates real opportunity. For sellers willing to price correctly, the path to a clean transaction is still there.
Newport Beach
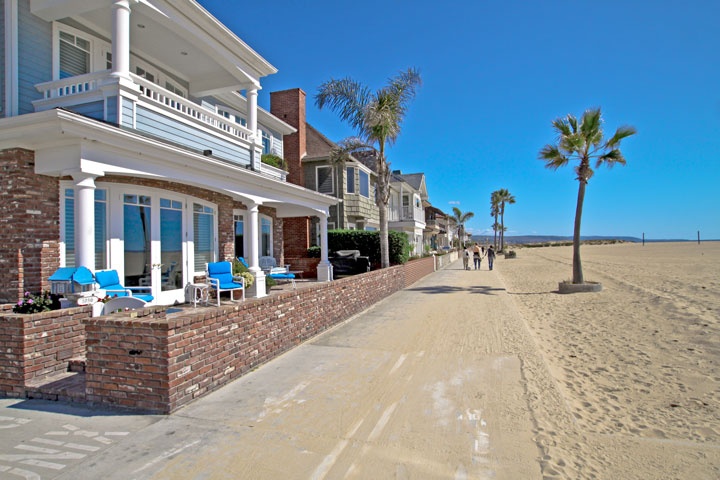
Newport Beach has the most homes for sale of any city in this report at 189 active listings. The average home has been sitting for 144 days. What stands out is that new sellers are still arriving at higher prices than the homes already on the market. Existing listings are priced around $5.8 million. New listings are coming in closer to $6.25 million.
Buyers are not meeting either number quickly, and one in three listings has already been reduced as a result. The market is sending a clear signal. Most sellers will eventually respond to it. The ones who move first tend to fare better than the ones who wait for the pressure to build.
Dana Point
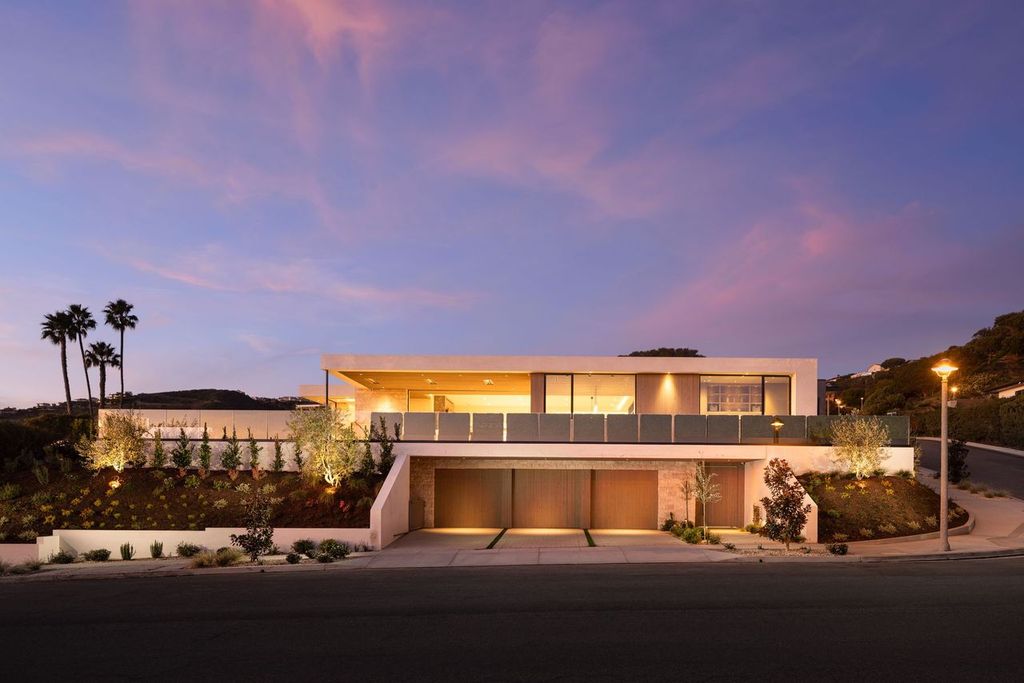
Dana Point is the healthiest market in this report. Only 42 homes are for sale, the tightest supply of the group. The average home takes 89 days to sell and the median is 53 days, the smallest gap between average and median in the report. The market is moving more evenly here than anywhere else.
The Dana Point Harbor revitalization is drawing real buyer attention and it is showing up in the numbers. If you are thinking about selling along this corridor, Dana Point is the market performing closest to where sellers want to be right now.
Laguna Niguel
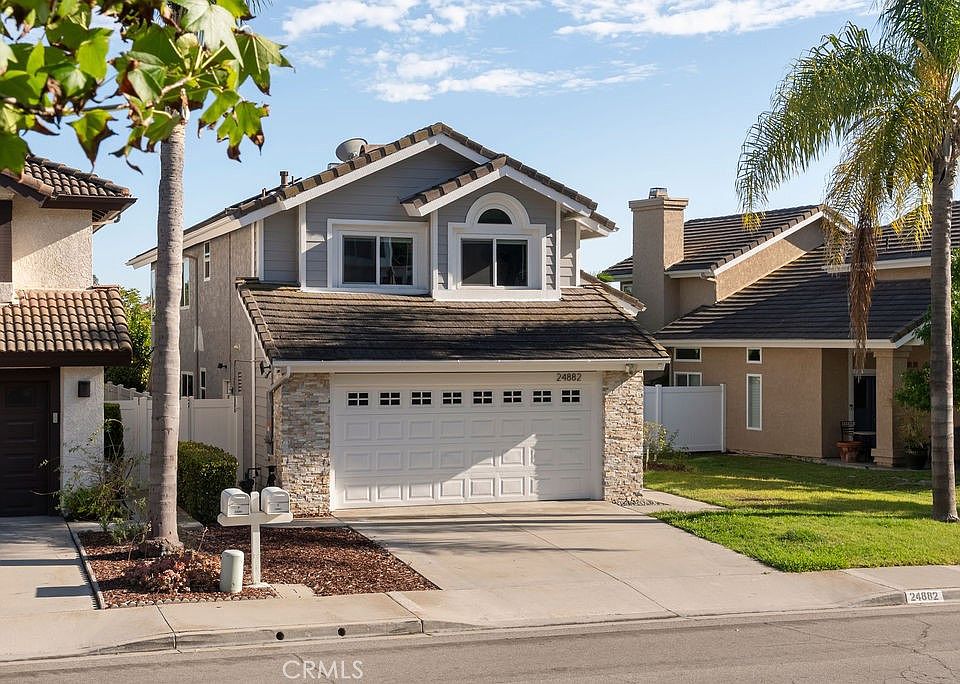
Laguna Niguel has the most pronounced pricing problem in this report. Forty-three percent of active listings have already had to reduce their price. That means nearly half of all sellers came to market too high and had to adjust. Fifteen percent of listings have been pulled off the market and relisted entirely, the highest rate in the group.
The homes that are moving are doing so in about 56 days. But the homes that are stuck are dragging the average up to 83 days. The issue is not buyer demand. The issue is sellers consistently overestimating what buyers will pay before the home even hits the market.
San Juan Capistrano

San Juan Capistrano is the most straightforward market in this report. Only 55 homes are for sale, and the average and median days on market are closer together than anywhere else at 63 and 49 days respectively. Homes here are moving consistently regardless of price point. Only 4 percent of listings have been relisted, the lowest of all five cities.
New listings are arriving at a median of $1,985,000, which is more conservative than what existing inventory is asking. Sellers here are calibrating before they list rather than adjusting after the fact, and the results reflect it. In a market that holds the lowest concentration of ultra-luxury inventory along this corridor, sellers are showing pricing discipline from day one. Expect that discipline to migrate north as inventory builds and more sellers are forced to reckon with the same data.
What Is Driving This Across the Board
The city-by-city numbers tell individual stories, but they are all responding to the same underlying forces. The buyer has changed, the rate environment has not, and the sellers who have not adjusted their expectations to match both realities are the ones accumulating days.
The buyer along this corridor in 2026 is not the buyer of 2021 or even 2023. The rate environment has been hovering in the mid-to-upper 6 percent range for months with no meaningful relief expected before year end. That does not stop qualified buyers from acting. What it does is make them precise. A buyer writing a check at $5 million or $7 million in this environment has done the math. They know what comparable homes have closed for. They know how long the listing has been active. They know whether a price reduction has already happened. And they use all of that information when they put together an offer.
The seasonal element is real but being misread by some sellers. Summer does bring a predictable pause in activity. Families are traveling, schedules are disrupted, and the pace of new pending sales naturally softens. But that pause is not permission to stay at an aspirational price point. The buyers who are active during the summer slowdown are the most serious buyers in the market. They are not casually browsing. They are ready to act on the right property at the right price.
The sellers accumulating days are largely the ones who confused the summer pause with a reason to hold their price rather than a signal to sharpen it.
What the Days Actually Cost
The real cost of overpricing does not show up in the list price. It shows up in what a home ultimately closes for relative to where it started, and how the market perceives a listing that has been sitting.
A home priced correctly generates early showing activity, creates urgency among qualified buyers, and closes at or near asking within the first thirty days. A home priced ten percent over what the market will bear generates initial curiosity, then silence. After thirty days, the DOM clock is working against the seller. Buyers begin to wonder what is wrong with the property. After sixty days, the seller faces a choice: reduce the price and relaunch with a stigma attached, or hold and continue accumulating days. Most reductions at that stage are chasing a market that has already moved on psychologically.
The sellers who win in this environment come to market once, priced correctly, with strong preparation and presentation from day one. The sellers who arrive overpriced and adjust reactively consistently leave money on the table.
"Your first price point is always your strongest. Make sure you get it right."
What to Do With This Information
If you are considering selling in any of these markets in the next six to twelve months, the data here gives you a framework for thinking about your position honestly.
- Ask about the price reduction rate in your city. If 34 to 43 percent of active listings have already been reduced, that is not a market anomaly. That is a market consistently rejecting prices that do not reflect today's buyer. Your listing will not be the exception unless it is genuinely exceptional in preparation and presentation.
- Look at the gap between average and median DOM. The homes closing at the median are the ones priced correctly. The homes pulling the average higher are the ones that were not. Know which category your property is likely to fall into before you list, not after.
- Understand what a well-priced listing actually does. A well-priced listing is not leaving money on the table. It is the strategy most likely to produce the strongest net result, because it generates early momentum, competitive attention, and a clean transaction rather than handing accumulating days and price leverage to the buyer.
The Bottom Line
The market across this corridor is still producing strong outcomes for sellers who approach it with discipline and for buyers who understand where the opportunities are. The data makes both of those cases clearly. The question is not whether to sell. The question is whether you are willing to price for the buyer who is actually in the market today.
Clay Smith · BonLife Real Estate · DRE #02425337
All market data reflects current real-time MLS profiles as of August 2026. This article is intended for educational purposes and does not constitute financial or legal advice.
Let's Talk About Your Property.
Pricing strategy is the most important decision you will make before listing. Let's make sure you get it right.
Contact Clay